|
User Guide |
|

|
Lines and Rectangles« Coordinate System | UserGuide | Drawing Properties » Page Contents (hide) To draw a geometric shape on the canvas, you call one of the many “draw” methods for use with a canvas that are defined by the GraphicsCanvas class. In this section, we show how to draw lines, vectors and rectangles. LinesStraight line segments can be drawn on a canvas using the drawLine() canvas method canvas.drawLine(x1, y1, x2, y2) A line is defined by the x- and y-coordinates of its starting and ending points on the canvas 
For example, the command canvas.drawLine(100, 100, 250, 175) draws a straight line segment on the canvas between the points (100, 100) and (250, 175). 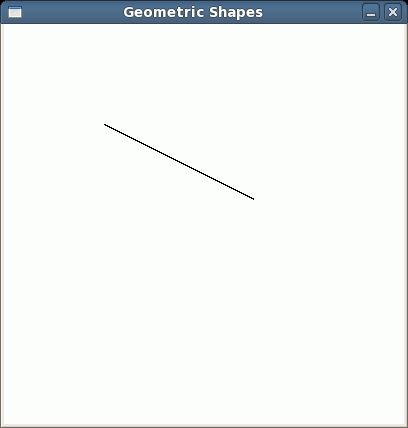
ArrowsA line segment can be drawn on the canvas with an arrow head at the end point, (x2, y2). 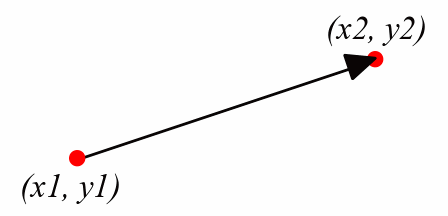
To draw an arrow on the canvas, use the drawArrow() method canvas.drawArrow(x1, y1, x2, y2) While the starting and ending points of a line segment can be interchanged, the arrow head on the arrow is always drawn at the end point of the line segment. RectanglesIn EzGraphics, a rectangle is defined by the position of its upper-left corner on the canvas and its dimensions. 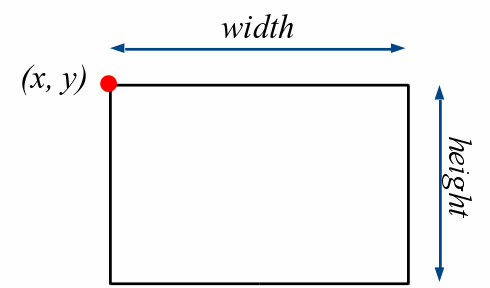
As you saw in the Getting Started section, rectangles can be drawn on the canvas using the drawRectangle() canvas method canvas.drawRectangle(x, y, width, height) For example, the command canvas.drawRectangle(100, 150, 60, 40) draws a rectangle that has a width of 60 pixels and a height of 30 pixels. The rectangle is positioned on the canvas with its upper-left corner at (100, 150). 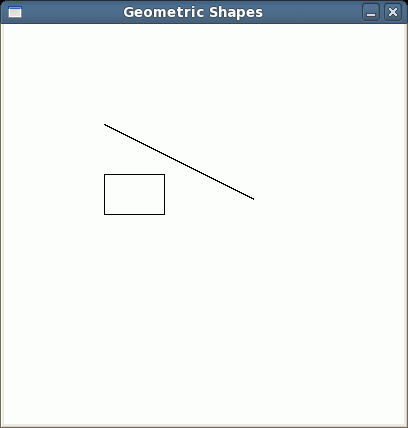
Sample ProgramThe following program illustrates the use of the three shapes presented in this section. The program draws a simple bar chart with both the x- and y-axes and five bars. 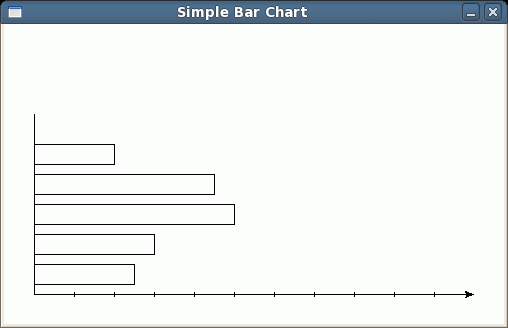
Program: barchart1.py
## barchar1.py # -- Draws a bar chart with horizontal and vertical axes. from ezgraphics import GraphicsWindow # Create the graphics window. win = GraphicsWindow(500, 300) win.setTitle("Simple Bar Chart") canvas = win.canvas() # Draw several bars. canvas.drawRectangle(30, 240, 100, 20) canvas.drawRectangle(30, 210, 160, 20) canvas.drawRectangle(30, 180, 200, 20) canvas.drawRectangle(30, 150, 90, 20) canvas.drawRectangle(30, 120, 50, 20) # Draw the axes with tick marks. canvas.drawLine(30, 270, 30, 90) canvas.drawArrow(30, 270, 470, 270) xOffset = 70 for i in range(10) : canvas.drawLine(xOffset, 268, xOffset, 273) xOffset = xOffset + 40 # Wait for the user to close the window. win.wait() |
|
Last modified: August 17, 2013, at 06:21 PM.
|